%201%20(1).png)
Align Data Shape with Chart Type
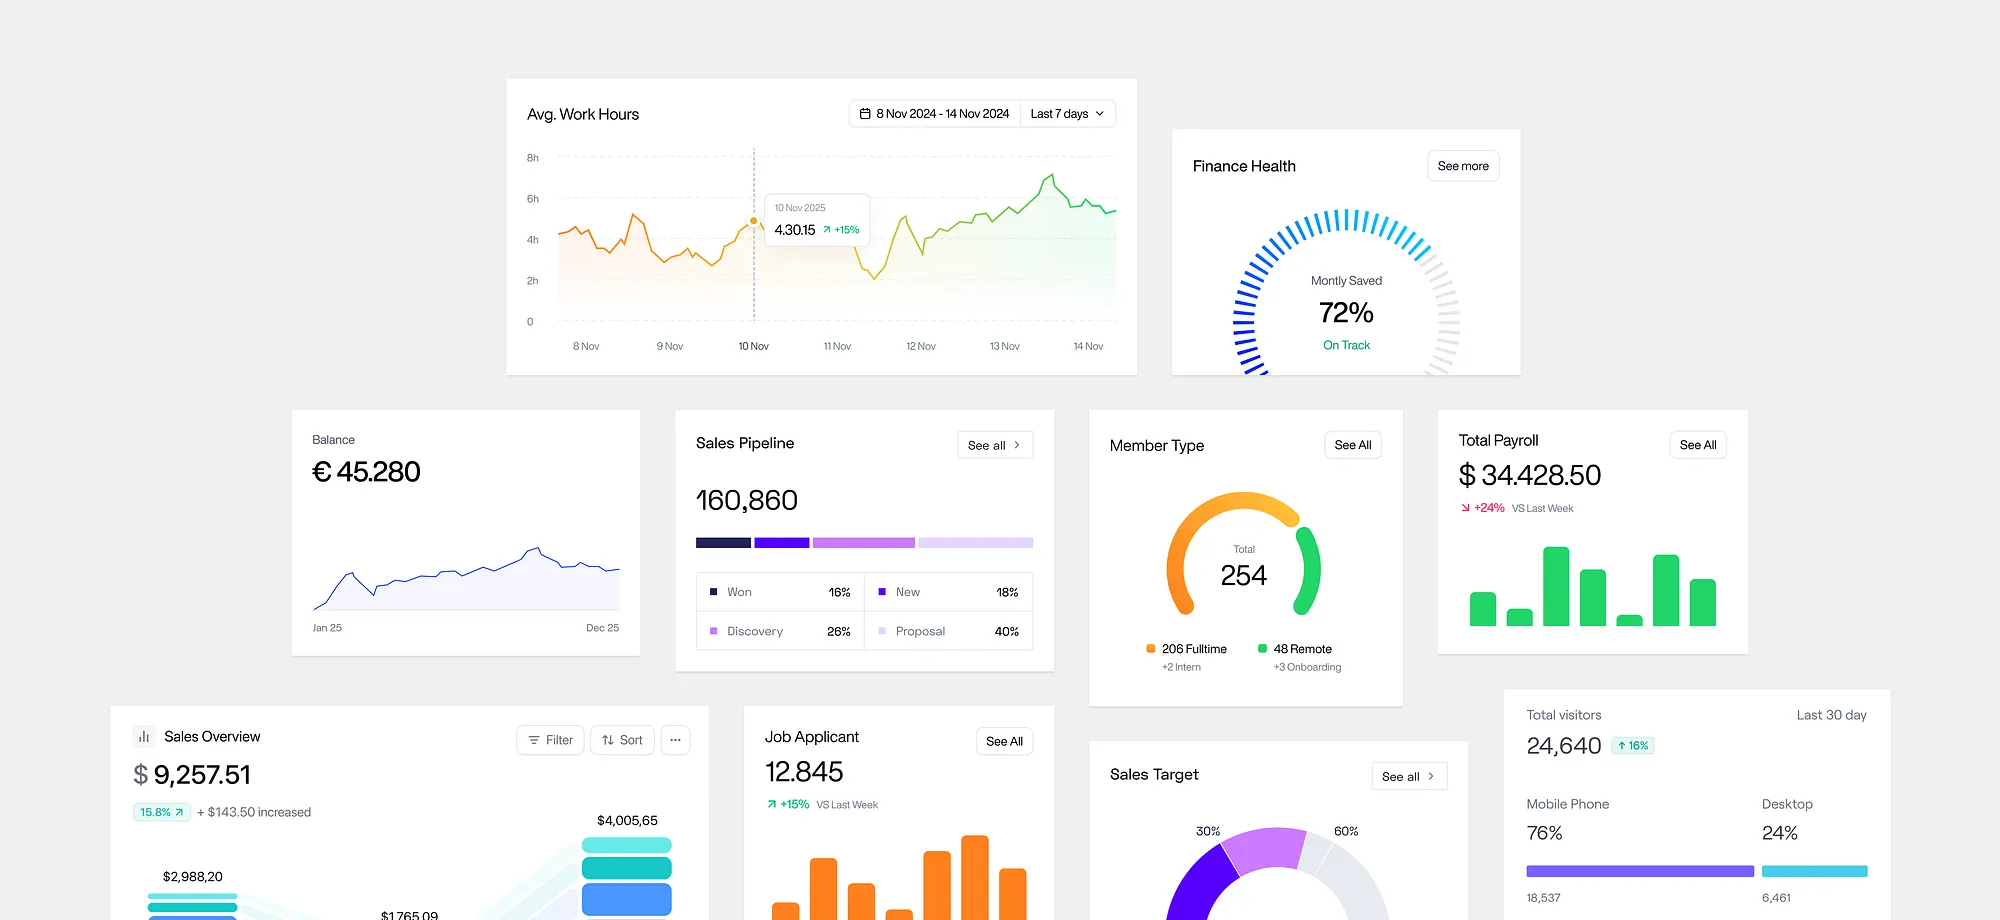
In product design, data is more than just raw numbers. Users need to see, understand, and act on data quickly. That’s why charts are an essential part of modern UI/UX.
Consider one key question before you begin designing your chart: What is your goal?
The 3 Cs for Better Charts
The 3 Cs are an easy way to remember the most important aspects of any good chart:
1. Context
People need to compare a number against another number in order to interpret it. Numbers require comparison to be meaningful; in UX, metrics like completion rate or task time must be compared across periods (e.g., year-over-year or before/after redesign) to show real impact.
2. Clutter-free
Use only visual elements that reinforce the intended insight, and avoid default or decorative chart styles that add noise or ornamentation because they weaken clarity and obscure the core message.
3. Contrast
Pay attention to how you use these three important aspects of your chart design to help viewers understand your point:
- Color: Show those key series or values in a brighter, bolder color than the others.
- Titles: Use a meaningful title that tells the audience the finding or takeaway.
- Callouts: This last element is optional. Callouts are annotations that add additional information to your chart. These might look like text or tooltips.
Choosing a Chart Type
There are many of different types of charts, but, for most UX purposes, we recommend the basics: bar charts, line charts, or scatter plots. Choose the chart that best suits your goal and the context you’re presenting.
1. Bar Charts
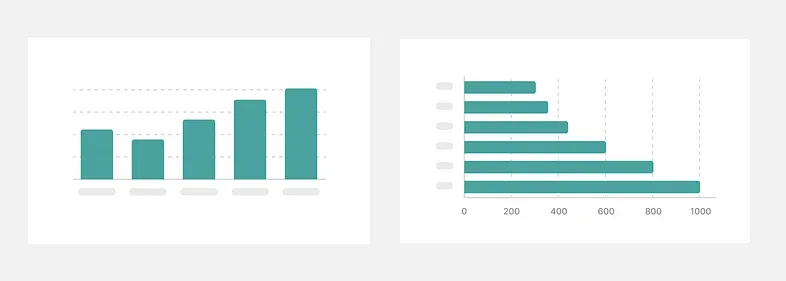
Researchers have found that bar charts are much easier for people to comprehend than other types of charts (like pie charts). This is because bar charts make it easy for people to quickly and accurately perceive the differences between values.
When to use
- To compare discrete categories.
- To compare before/after.
- When users need to quickly see which is bigger or smaller.
2. Line Charts
Press enter or click to view image in full size
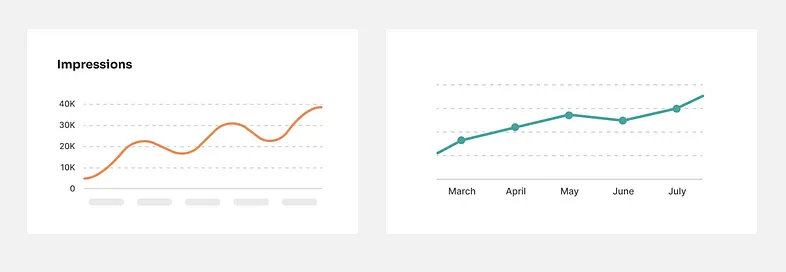
Researchers have found that bar charts are much easier for people to comprehend than other types of charts (like pie charts). This is because bar charts make it easy for people to quickly and accurately perceive the differences between values.
When to use
- To track long-term trends.
- When the focus is on continuous changes.
3. Pie Chart & Donut Chart
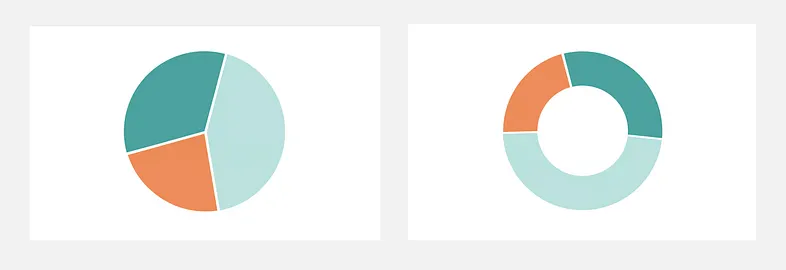
Pie charts are familiar to everyone, while donut charts are more modern and leave space in the center for labels.
When to use
- To illustrate percentages and proportions.
- To answer: “How much does each part contribute to the whole?”
Best Practices for Designing Charts
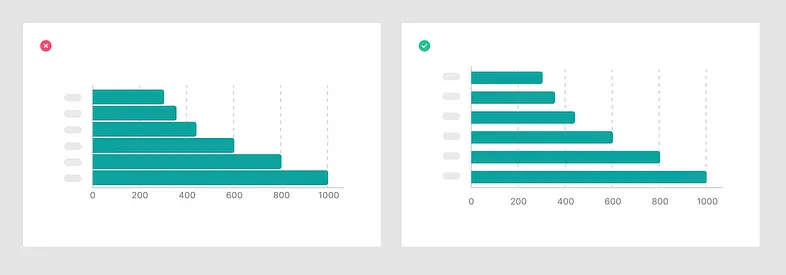
1. Add enough white space
White space helps distinguish between the chart elements: the label, the legend, and the chart itself. It adds balance to charts and makes it easier to scan and comprehend information.
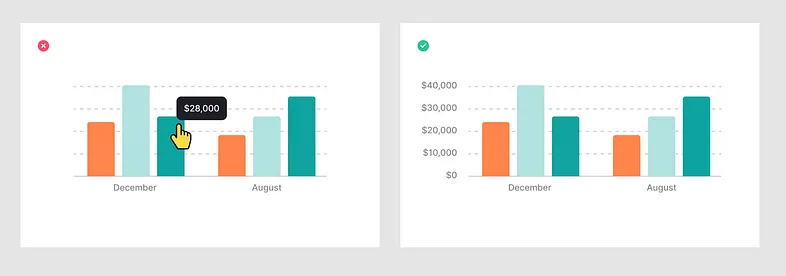
2. Add chart annotations
Chart annotations are essential enhancements that add explanatory or supplementary information to a chart, helping to clarify data and emphasize key points.
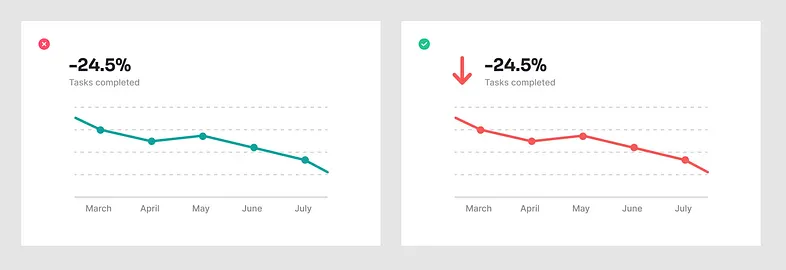
3. Add visual hints
To make analyzing a chart simpler and more intuitive, it’s helpful to add visual hints. For instance, you might use a green arrow pointing upward to show that a value is increasing, and a red arrow pointing downward to indicate a decrease.
Conclusion
A chart’s role is to communicate a clear data story, so always provide relevant comparisons and select the chart type that best matches the data structure and the insight being highlighted.
References
- https://www.nngroup.com/articles/choosing-chart-types/
- https://app.uxcel.com/courses/ui-components-best-practices/charts-best-practices-201
- https://medium.com/design-bootcamp/charts-in-ui-ux-turning-data-into-stories-d7a39f4f7846


Our awards & recognitions.













Ready to discuss your project with us?
Chat with Us